
There has been a lot of talk about the falling homeownership rate in the United States. In December 2004, the homeownership rate reached an all-time high of 69.4%, while the current rate is 62.9%. When comparing these two figures, there is some room for concern regarding the difference.
However, today we want to shine some light on the issue by:
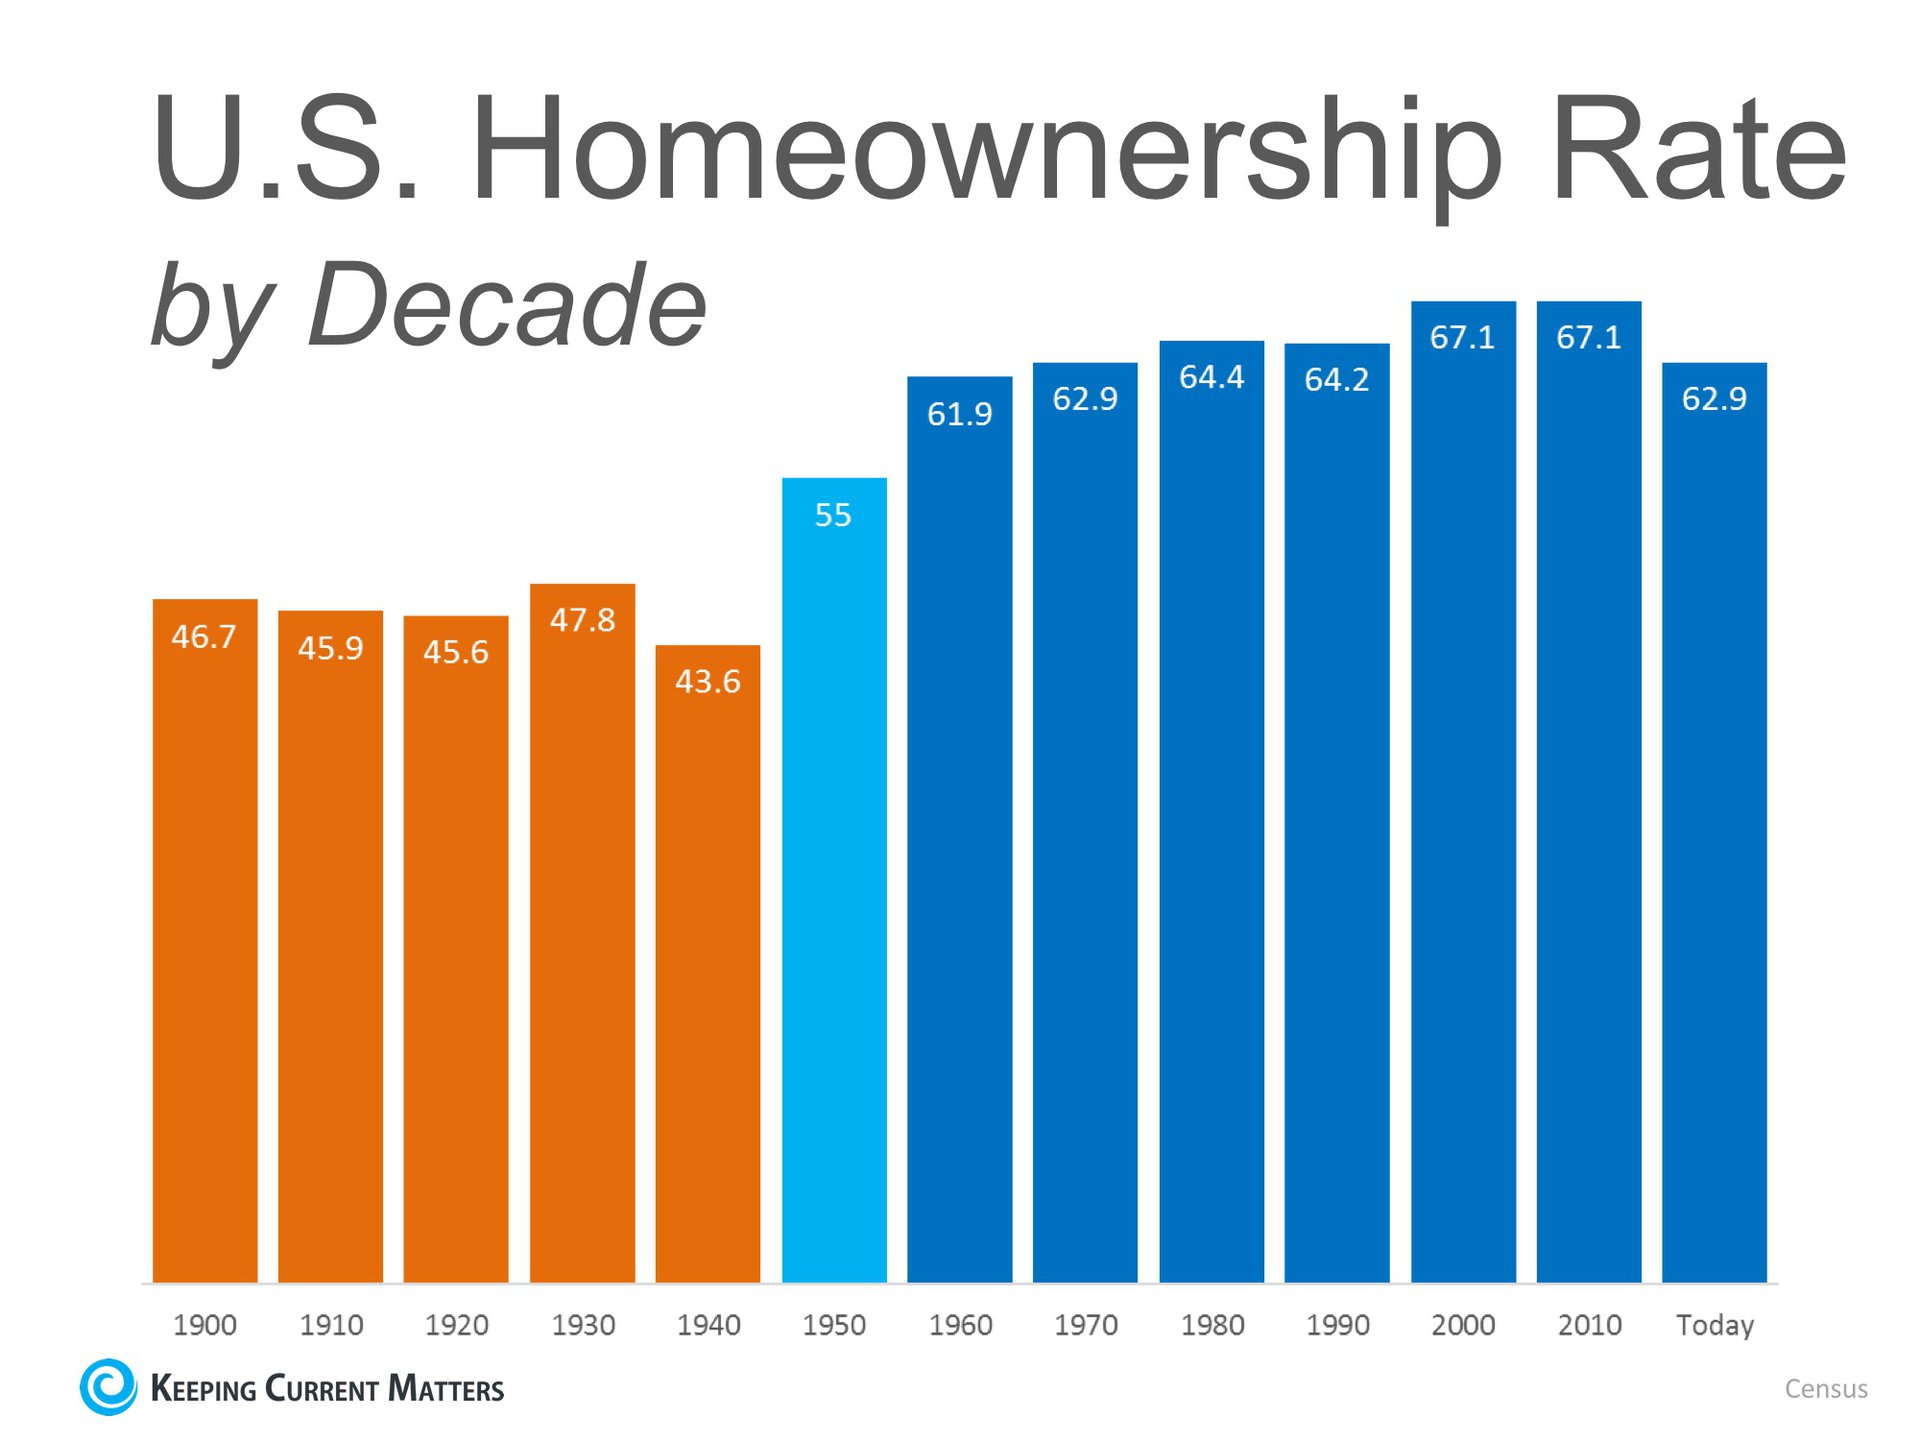
- Showing what historic homeownership rates have looked like over the last 130 years.
- Breaking down the current percentages by state.
Historic Homeownership Rates:
Current Homeownership Rates by State:
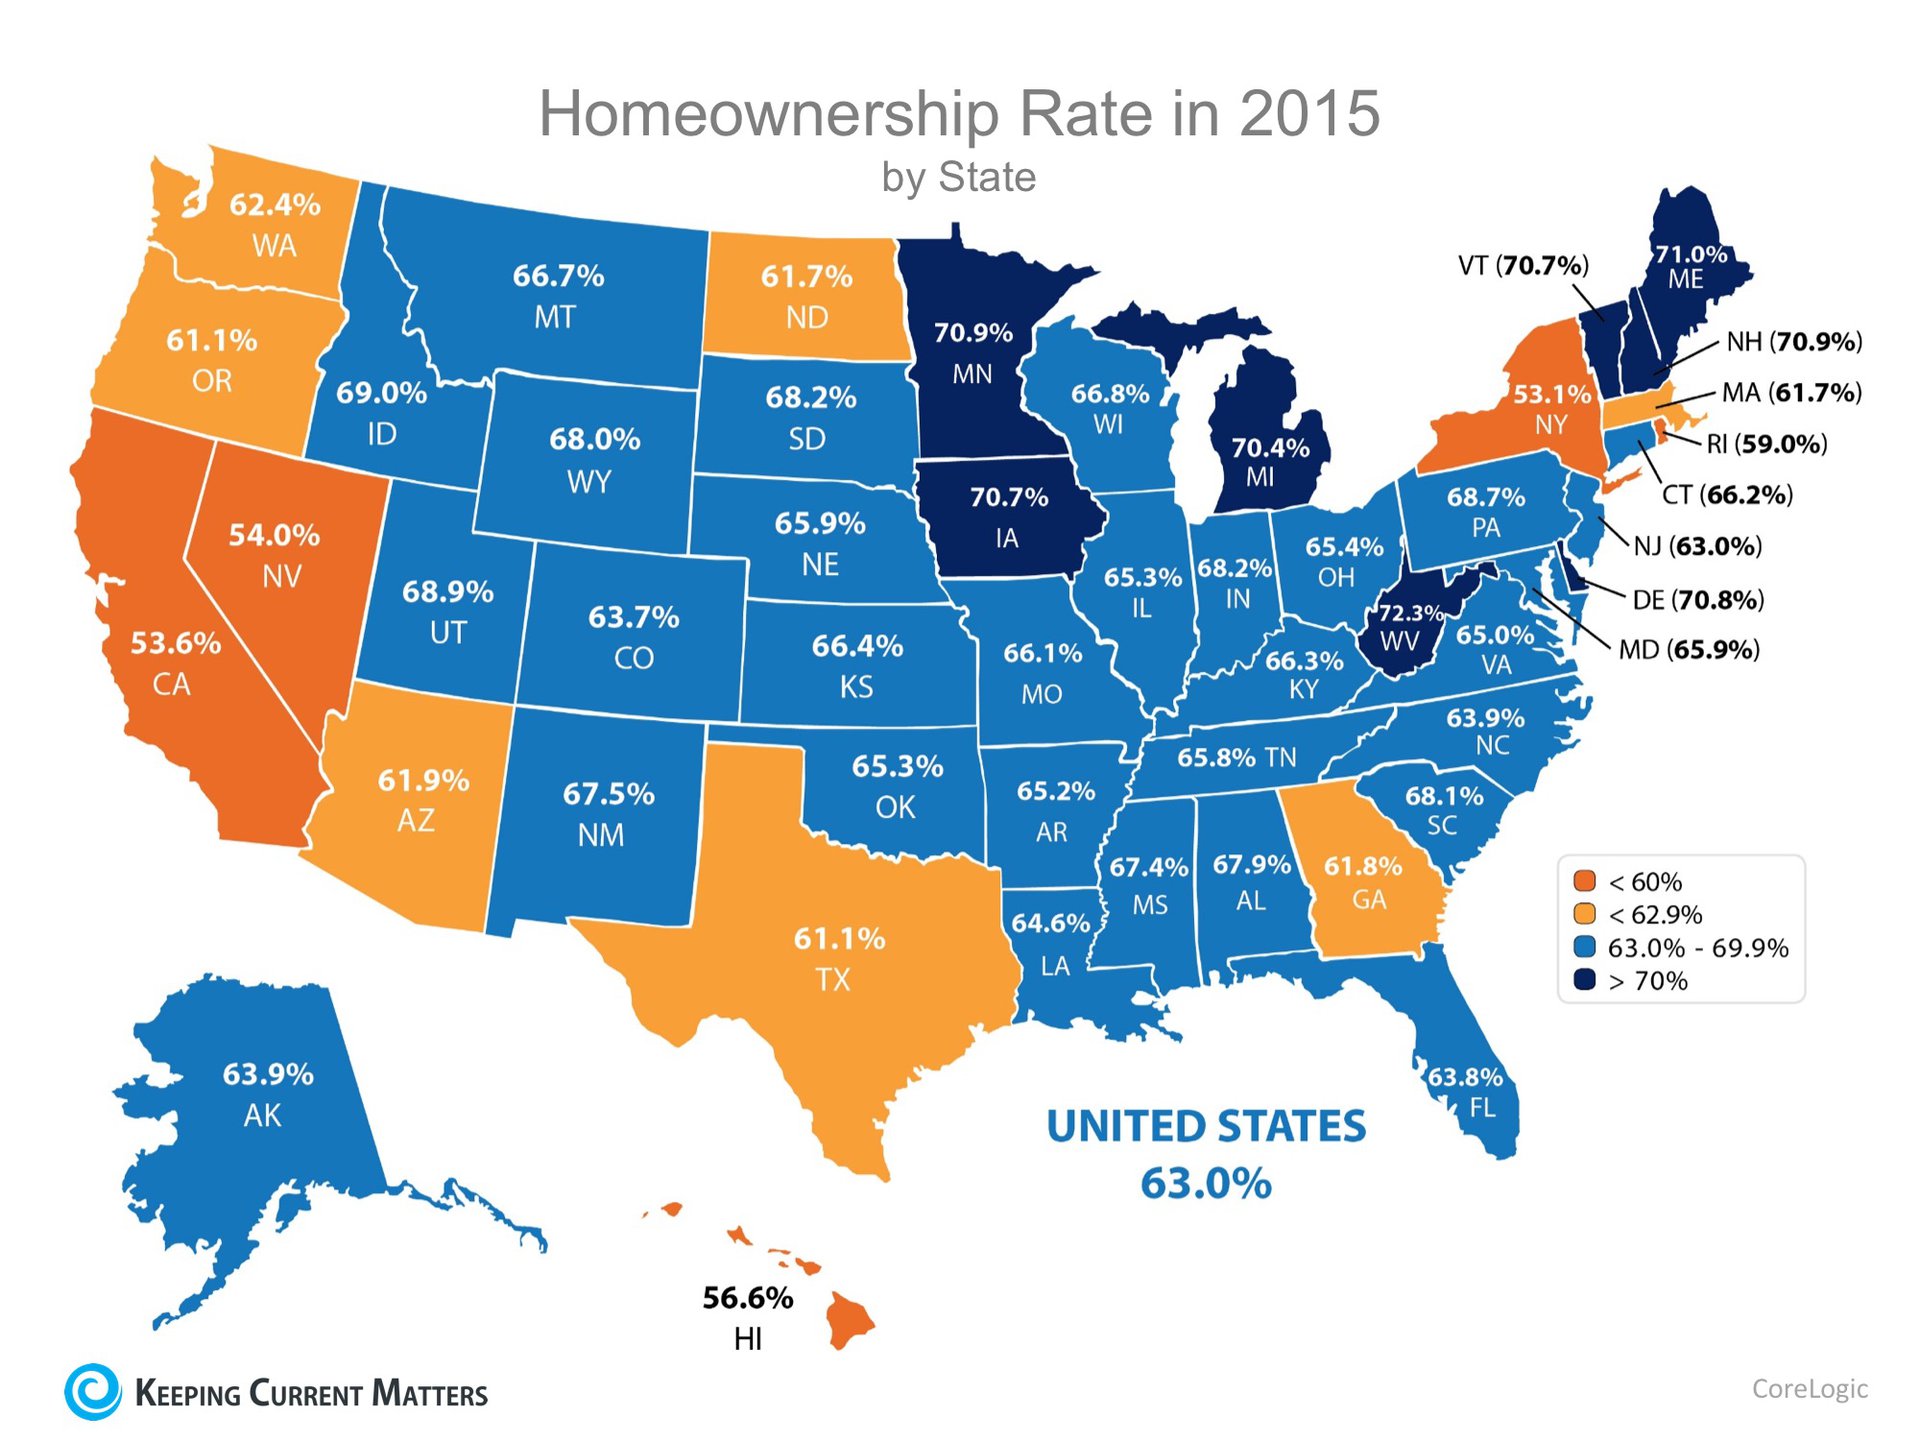
All of the states that you see in blue on the map above have a greater homeownership rate than the national average.
Bottom Line
Though the homeownership rate has fallen recently, the percentage is still at a healthy rate compared to historic numbers, and most states currently have a higher percentage than the national average.
| Members: Sign in now to set up your Personalized Posts & start sharing today!
Not a Member Yet? Click Here to learn more about KCM’s newest feature, Personalized Posts. |
 |